I am very pleased to announce version 2 of my “Microsoft 365 Call Flow Visualizer” Script. Those who follow me on Twitter, might have already seen a glimpse of what I’ve been working on in my spare time for the past few months.
What am I talking about?
At work, I build or configure Microsoft Teams call flows almost daily. Even though the Teams Admin Center provides an easy-to-use graphical user interface to set up auto attendants and call queues, the solutions are not always that straight forward. If you’re creating your very first call flow, chances are that you will start by creating an auto attendant. Why wouldn’t you, it’s where the call first hits your system, isn’t it? Later on, you discover that you can’t even configure the most basic call flow, because you have not created your target call queue yet.
Living in a fast paced world
What if three months down the road somebody from the office or a customer asks you how their main number handles incoming calls? Are you still able to answer that without logging into the Teams Admin Center and clicking through all the nested auto attendants and call queues?
They probably want to know things like how long does it ring before a call is transferred? Where is it transferred to? And which users are configured to answer calls? Just to name a few. If you manage a lot of customers, or work for a large organization with dozens of call queues, answering these kinds of questions can cost quite some time and resources.
What if I told you that you could just run a script which will render a diagram containing your call flows automatically? Would that be something you might be interested in? (Shout out to all the Entourage fans out there.)
Finding inspiration in Microsoft Docs
docs.microsoft.com is arguably one of the best product documentation sites on the web. Of course, that can differ from product to product but overall, it’s a very solid approach to documentation. When docs.microsoft.com was introduced in 2016 Microsoft even said that eye tracking studies have shown that content with a fixed width is easier to read. This really got my attention and made me believe that Microsoft has put some real effort into creating their product documentations.
I am by no means a professional developer. I didn’t even really know what Markdown is at that time. After doing some research I quickly understood that all or most of their documentation content is based on Markdown files which are hosted on GitHub and rendered into a website.
I started to pay attention and noticed that many other companies, like Bitwarden, my favorite password manager, also use Markdown based documentation websites. This underlined my hunch that Markdown based docs are the real deal.
No more confusing file versions, people creating and changing their own versions of documentations without telling anyone and so forth. With a Markdown based documentation solution, everything is stored in a central repository and every change is tracked with GIT. I need this too. But how do they do it?
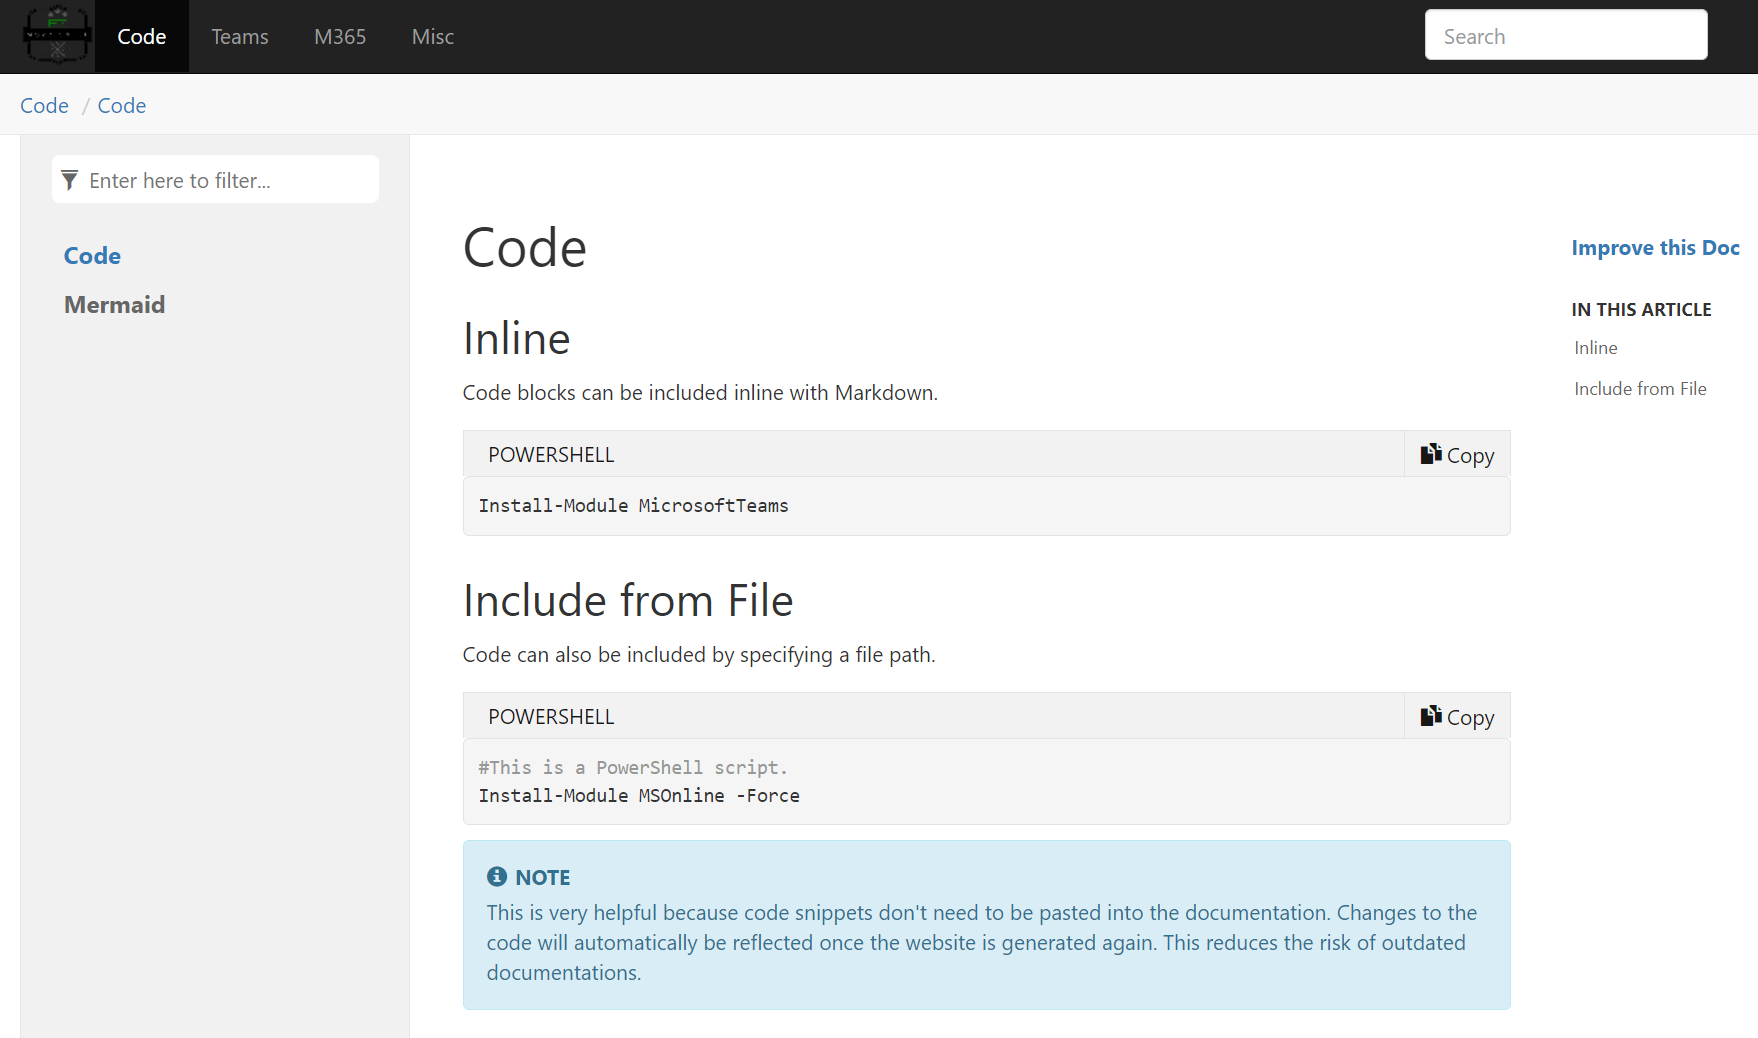
Another quick research session led me to DocFx, a static website generator for Markdown files maintained by the .NET team. After some tweaks here and there, my documentation site was already up and running.
Lazy is the new smart
Nobody likes writing documentations. Including me. But what if I could start to write some PowerShell scripts which will automatically retrieve specific information about a Microsoft 365 tenant and save it to Markdown files? Basically, let the scripts do the work for me? What at first was a proof of concept quickly turned into a full-fledged documentation website containing all sorts of data.
One tool down, two to go
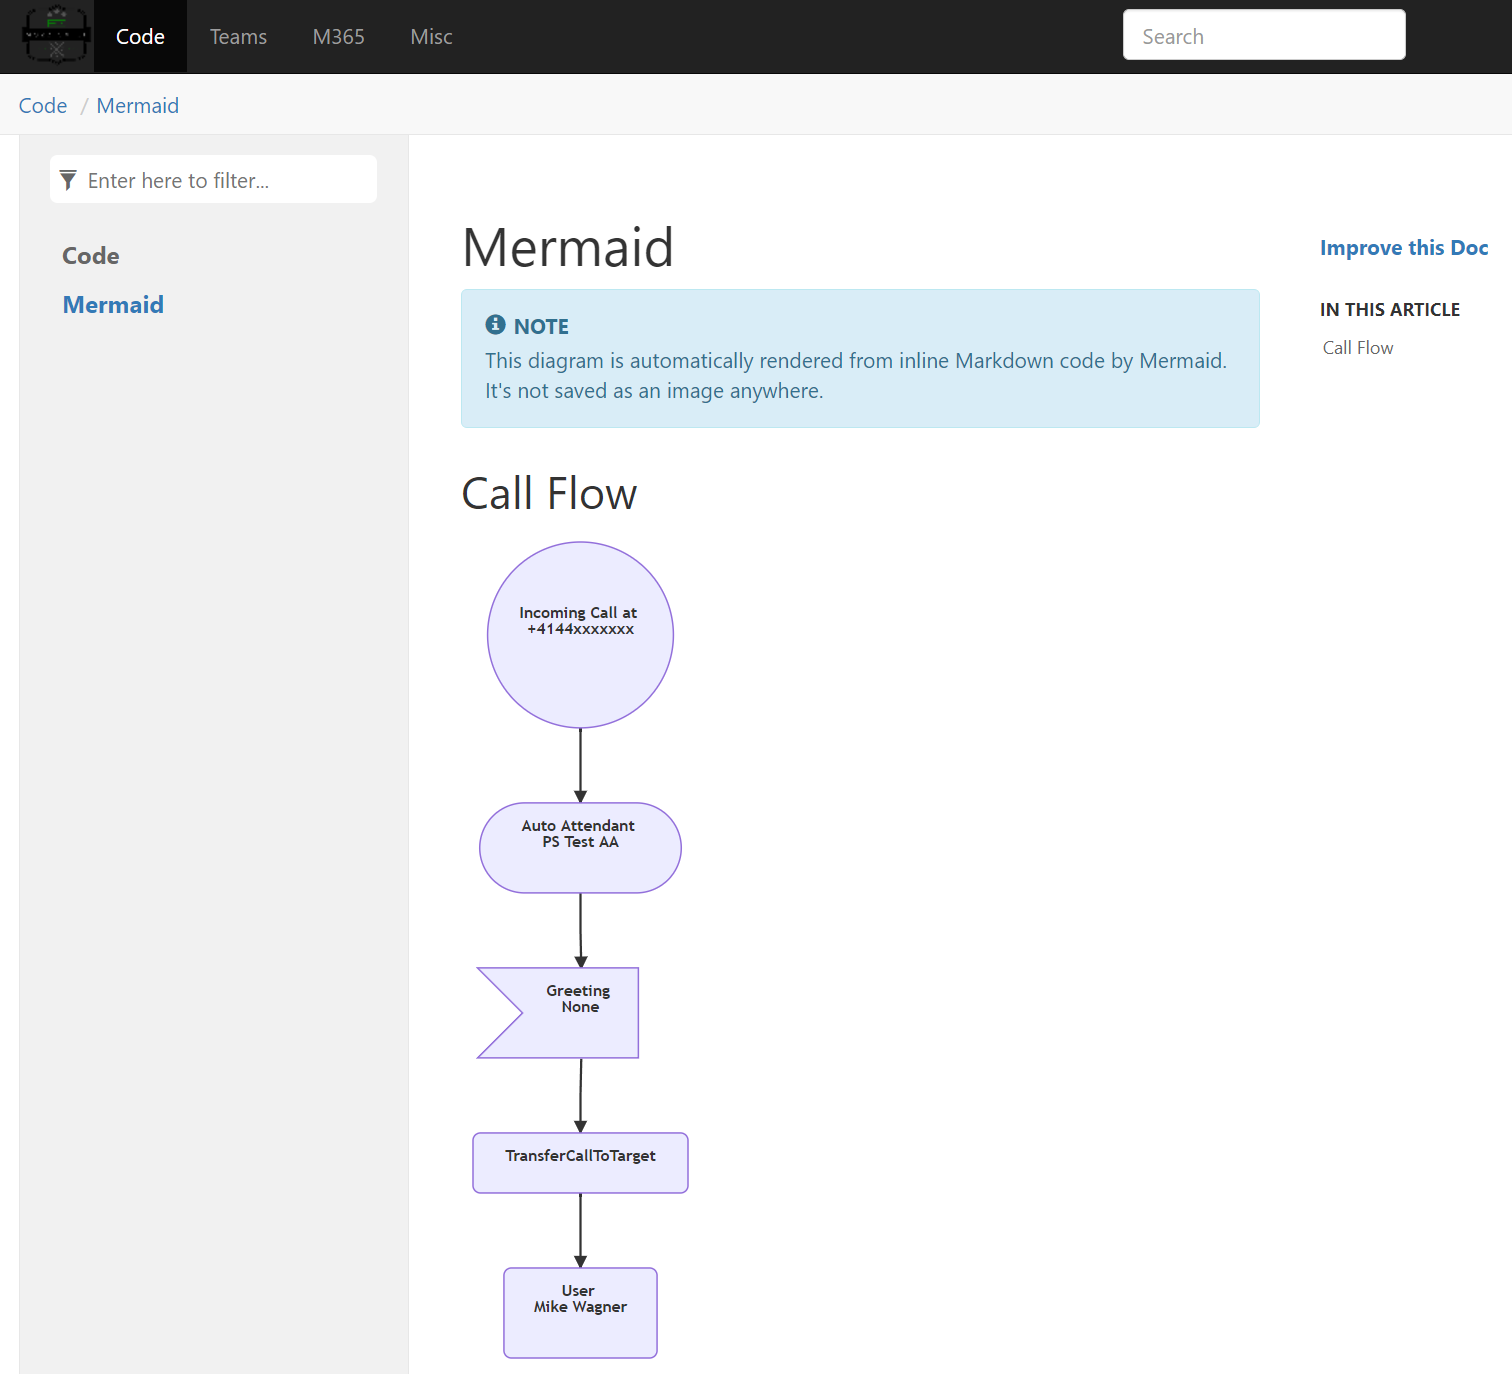
With DocFx I was able to automatically structure and render information into a user friendly and comprehensible website. Next up are diagrams. I hate fiddling around with diagram drawing tools. Creating links between nodes, rearranging, and resizing shapes etc. can be a really frustrating and time-consuming chore. Once again, I searched the web for a tool or a technology which can render diagrams from code. That’s when I discovered Mermaid. Mermaid uses JavaScript to render diagrams and flow charts from code. The learning curve was quite big at first. I probably would have been faster if I had just drawn a call flow diagram in Visio. But since Mermaid also offers an excellent live editor, I essentially got the hang of it. Now I can create diagrams a hundred times faster and without the hassle of manually drawing them.
The final piece
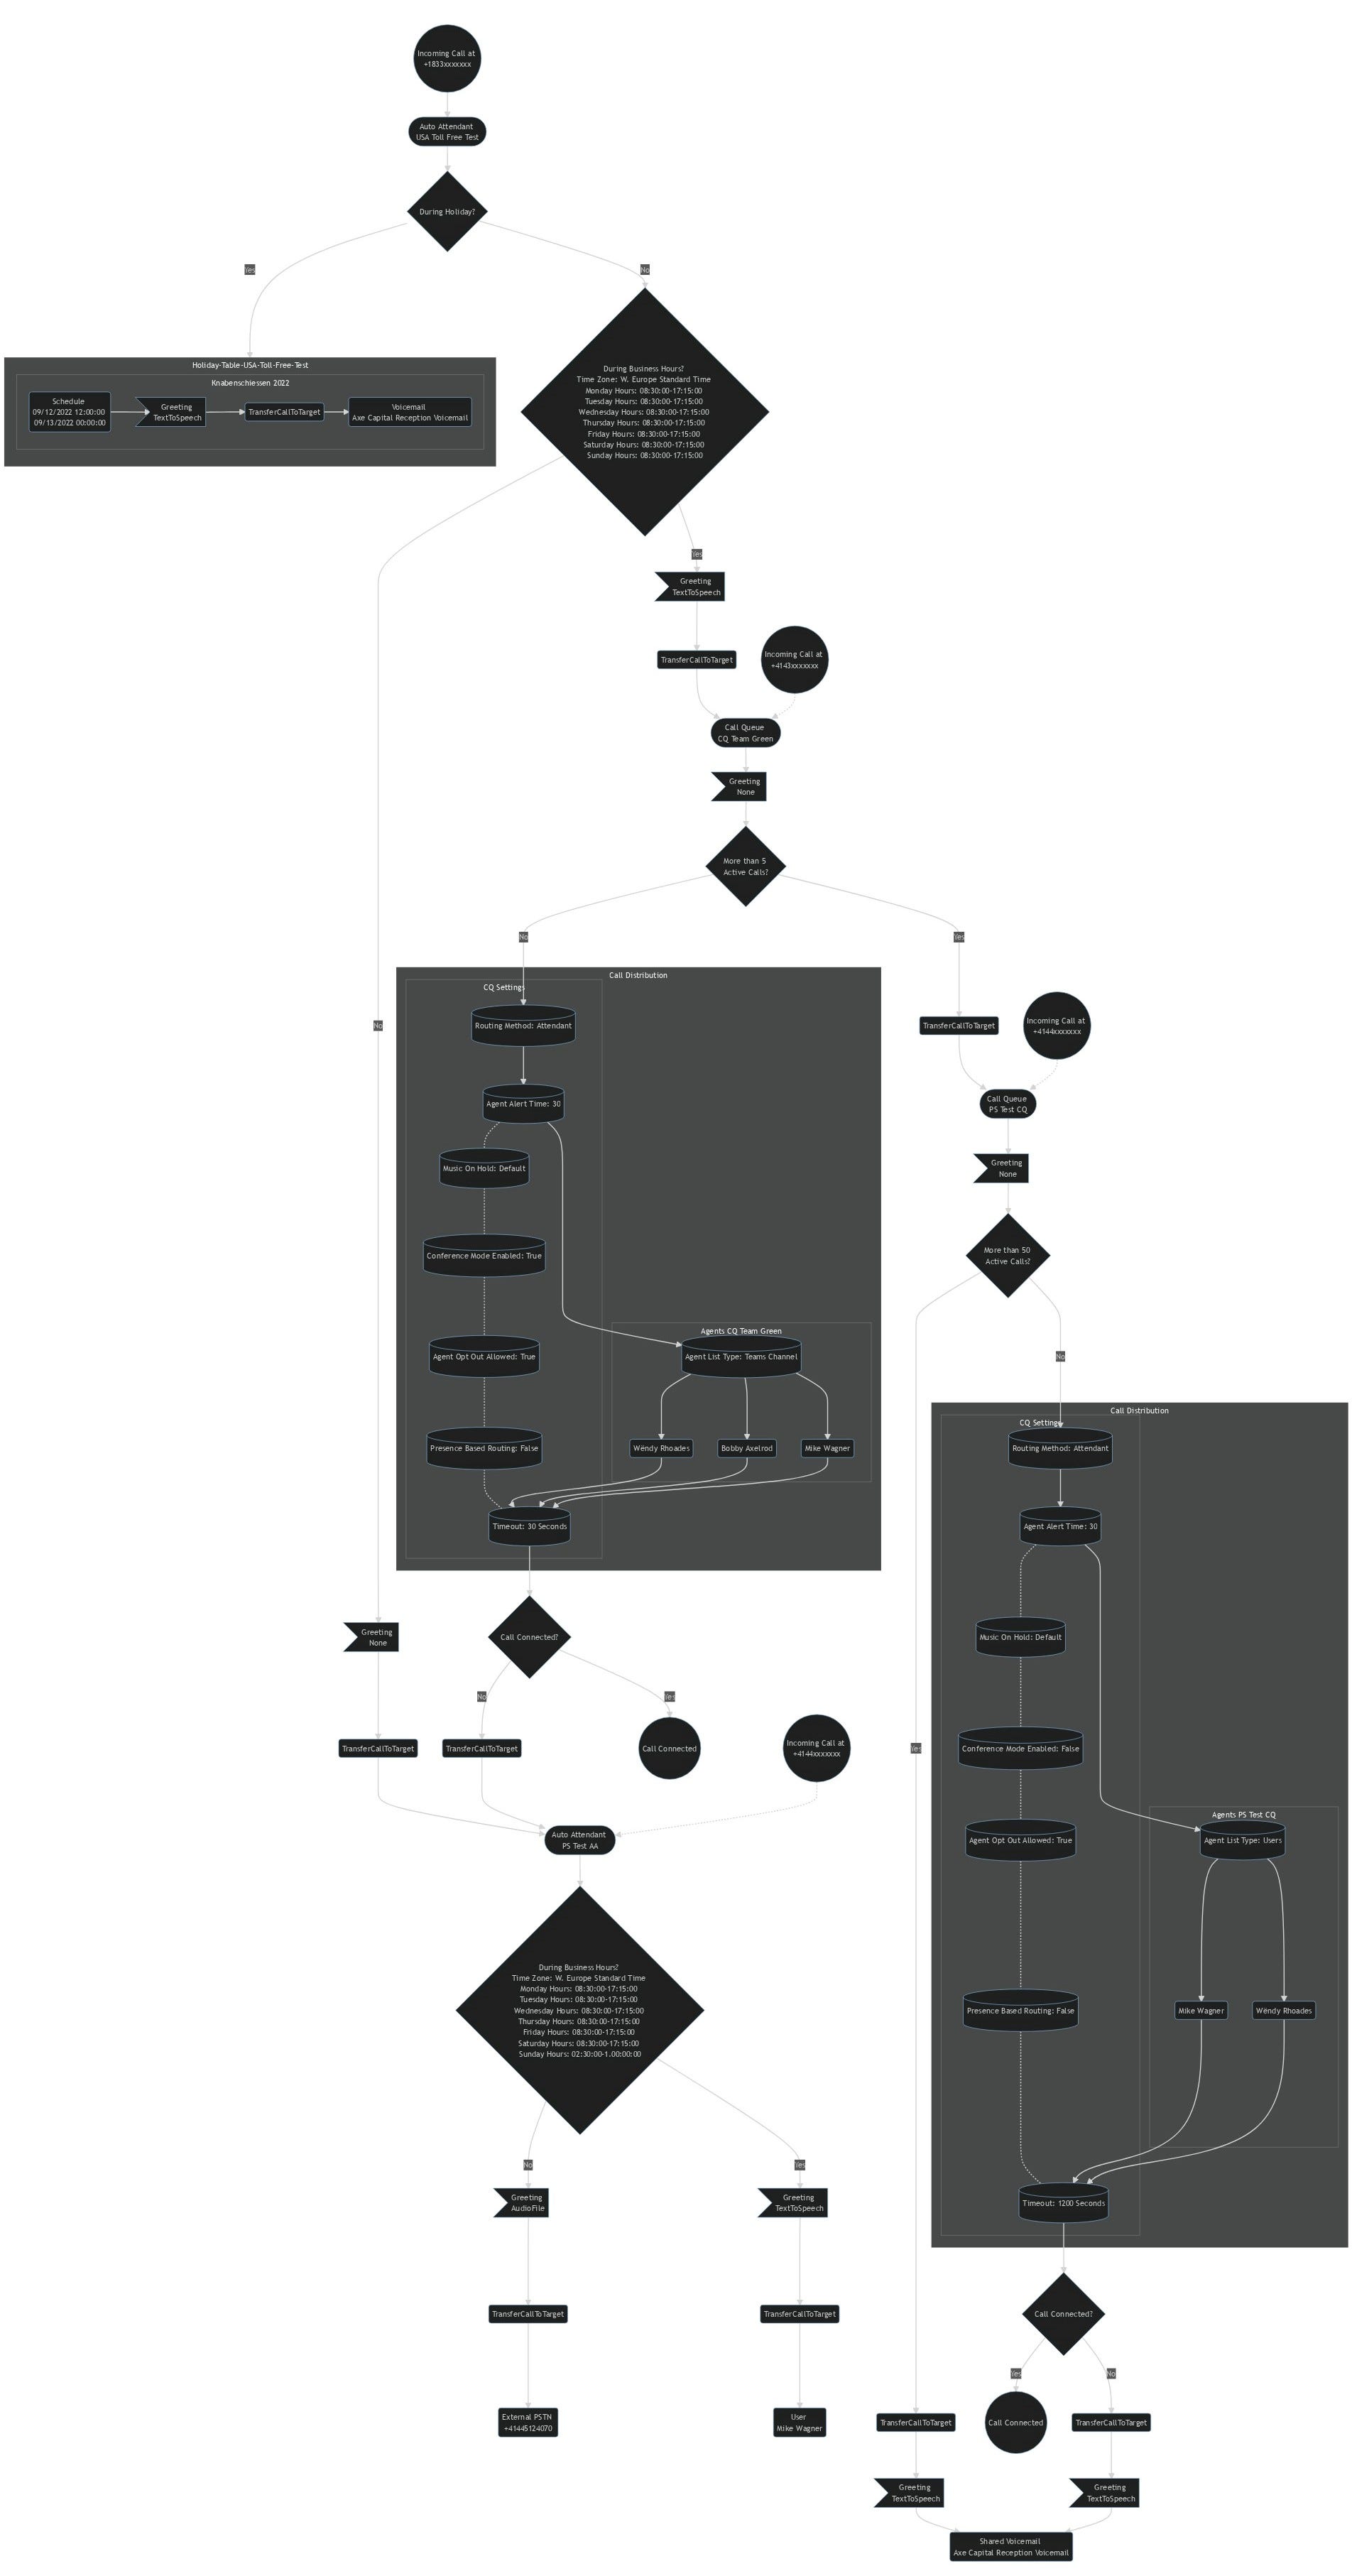
The final step of my vision was to connect all the dots. Use PowerShell to read call flows from Microsoft Teams, save them to markdown files and generate a website which will display said call flows. Of course, all of this should happen automatically and update the contents of the website on a schedule. I’ve got everything I need to achieve this except the tool to generate the flow charts.
For this one, I was sure that there’s no off the shelf solution. So I started writing some PowerShell code to get all the details needed in order to display a call flow. This was a mere proof of concept at first too. I soon discovered that this project would be much more complex than initially anticipated. But I just kept on coding, experimenting, and adding stuff to my script. After a few weeks of working on this project on weekends and evenings I published a first version of my script on GitHub.
The challenges kept on coming
Even though you can only create two different types of voice apps in Teams, the number of possibilities how they might be connected to each other seem limitless. I quickly realized that I will never achieve my goal with the current version. So, I started working on an updated version.
Learnings
I started learning PowerShell about three years ago. Since then, I’ve created numerous smaller and larger scripts to automate things. But I’ve never even attempted to write something as big and complex as this. Nor had I used functions a lot. Nevertheless, this feels like I was able to put almost everything I learned about PowerShell in the last years to good use. Once I realized that the script needs to be much more flexible and dynamic, I started to divide my first version of the script into separate functions. Even then, I hit several dead ends and had to rewrite a lot of the code.
Even though it was a lot of work and I’m sure that it’s not the most efficient or clean code you will find on GitHub, I still learned a lot during the development of my tool. The most important part of this story is that you don’t necessarily have to be a pro dev to create something like this. We live in a world full of developers who create awesome tools, frameworks, or other technologies every day. Sometimes it’s just about vision, determination and being able to understand how different technologies can work together.
I’m very proud of what I achieved and super happy with the result. Feel free to head over to GitHub and give the M365 Call Flow Visualizer a spin. I hope that you like what I’ve done and that you may find it useful. Please contact me on Twitter if you have any questions or feedback.